SQL Server 2008 Profiler
SQL Server Profiler is one of the performance tools that are available in the SQL Server 2008. But this tool has been mostly under utilized by the Database Administartors. The SQL Server Profiler does various functions like:
- Tracing : To trace what has been done in the SQL Server’s Engine and to find out how the queries have been resolved.
- Finding the scripts that are running in order to accomplish the T-SQL commands.
- Creating the Trace
- Watching the Trace
- Storing the Trace
- Replaying the Trace
Various T-SQL scripts that are running simultaneously in the SQL server are included in the trace. The trace becomes huge since it has all the T-SQL scripts that are running on the server In order to avoid this condition, it is better to consider only the data that is needed for the analysis.
Terminologies used in the SQL Server Profiler
Now, We are ready to learn how the SQL server Profiler works. But before that, it is necessary that one should know the terminologies used in order to learn the working of the Profiler without much difficulty. The various terminologies used in the SQL server Profiler are event, event class, event category, trace, data column, template and filter.
Event: Within the instance of Database Engine of SQL Server, there is an action and this is termed as an event.
Examples for Event : Creating the jobs, Running the stored procedures, Running the T-SQL scripts and performing operations in the SSMS.
Event Class: Event type which can be traced is defined as the event class.
Examples for Event Class : RPC : Completed and SP : Starting
Event Category: Event category are defined as the group of events. Any number of categories can be used, even if there is only one trace.
Examples for event category : Locks and stored procedures.
Data Column: An event class attribute that has been captured in the trace is called as data column. The event class values are present in the data column.
Trace: Capturing the data depending on the filters, event classes and data columns that are selected is called as Trace. These traces are normally stored in the trace files and also in the database.
Template: Trace's default configuration is defined as template. Between the same instances of SQL server, the templates can be exported, imported and saved. But, between instances of different SQL Versions, the templates cannot be imported. Nine pre-created templates are available with the SQL server 2009. All T-SQL and SP batches are captured by the default template. The default template is also known as standard template.
How to start the SQL Server Profiler?
The SQL Server Profiler can be started in various ways and let us see them here. SQL Server Profiler can also be installed separately from the database engine of SQL server. In order to start the SQL Server Profiler, the user should possess the system admin rights.
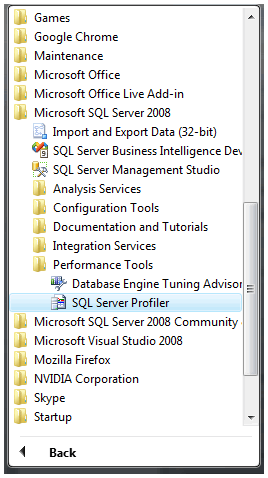
Click on “Start” in your computer and then choose “ALL PROGRAMS”. From All Programs, choose “Microsoft SQL Server 2008” and then choose “Performance Tools” and finally click on SQL Server Profiler as seen below.
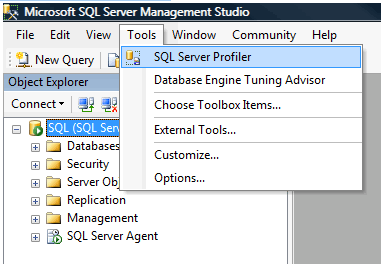
The other way to make use of SQL server profiler is open Microsoft SQL Server Management Studio if you have already have a chortcut icon in your desktop. Click on the Microsoft SQL Server Management Studio and select tools from the menu. Then click SQL Server Profiler as seen below .
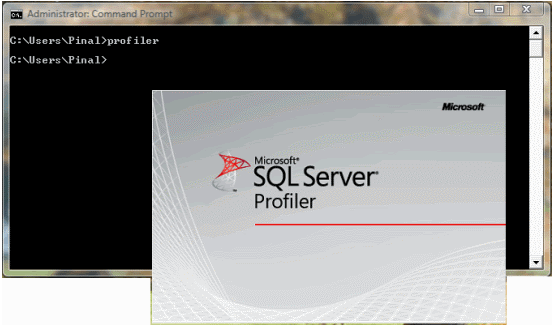
One can access the Profiler through command prompt too. In SQL Server 2008, type profiler as shown below. If you use 2005 version of SQL Server, then type profiler90 instead of profiler in the screen.
How to collect the data using the SQL Server Profiler
Connect the profiler to the needed database once it gets started. The SQL Server Profiler can be connected to any database and there is no restrictions that we should connect only to a particular database. With the proper admin role and authentication, it can be connected to the database and hence the data can be captured. Once the profiler starts, click on Menu, go to File and choose New Trace.
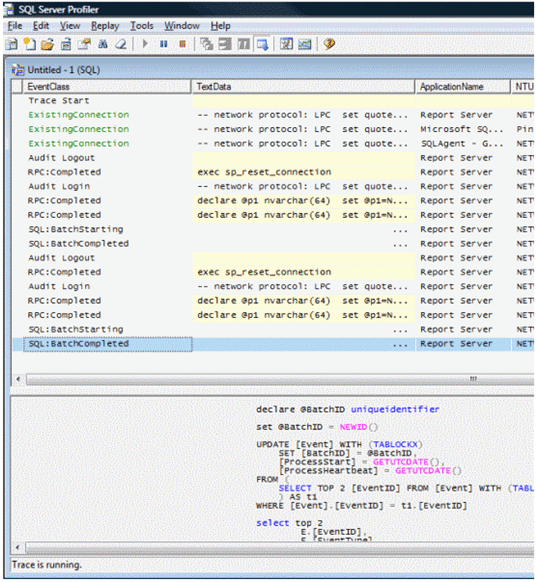
Thus the data has been collected and you can save it in a XML file or trace file. If needed, import the trace file in the profiler again and the profiler runs the whole process again based on your requirements. The trace file can be queried with the help of T-SQL if it is saved in the database table.
SQL Server Tuning Wizard
After closing the SQL Server Profiler, we go to the Enterprise Manager to run the wizard. The index tuning wizard uses the trace that has been confined from the SQL Server Profiler. You can run the wizard after collecting the data or trace.
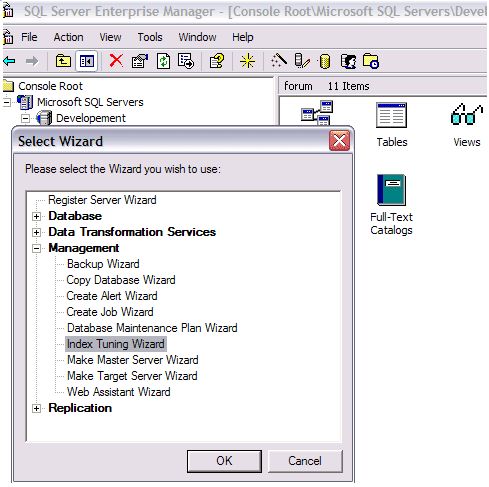
In order to run the index tuning wizard, choose the wizard icon and then select it from the management group. One can go to this screen directly from the command prompt by using the itwiz.exe.
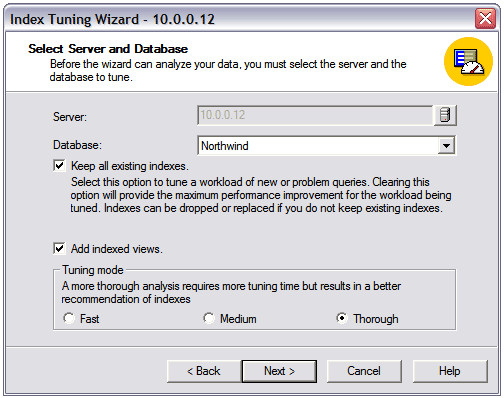
Then you can change the server if needed and you can select the database from the list as you wish. Select the check boxes if you need those properties, else you can deselect it. Now click “next” to continue.
You can use the database or trace file in order to start the wizard. The third option is grayed out and it will be available if you run the wizard from the query analyzer.
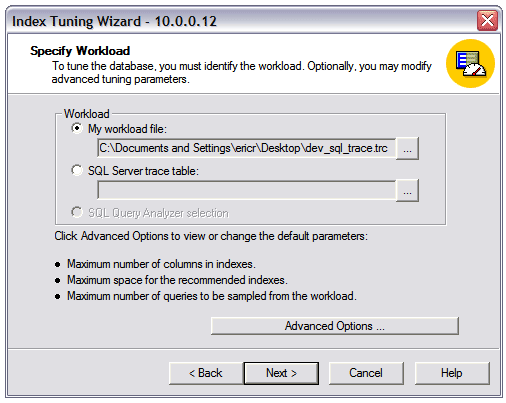
Now click advanced options button and you will get the following screen.
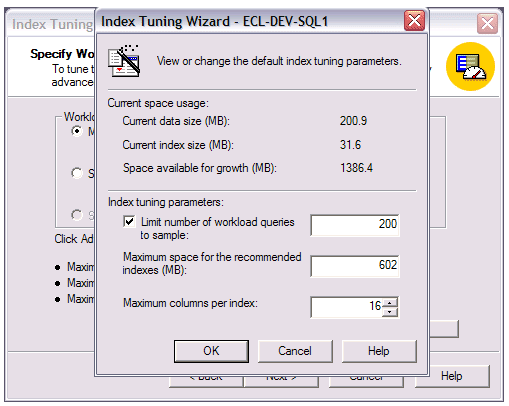
In this window, you can set three parameters as shown in the window. One is for limiting the number of queries, the second one is the space for the indexes and the last one is the no of columns per index. All these details can be filled out here. Now click Ok and click “Next”.
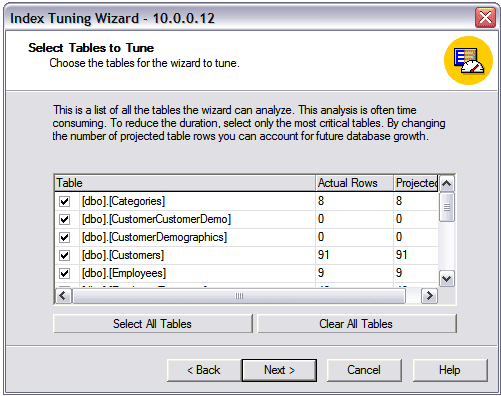
Here you can select the tables that your wizard needs to run. If large number of tables is chosen, then the optimization potentiality will be longer. Select the tables and click “Next”.
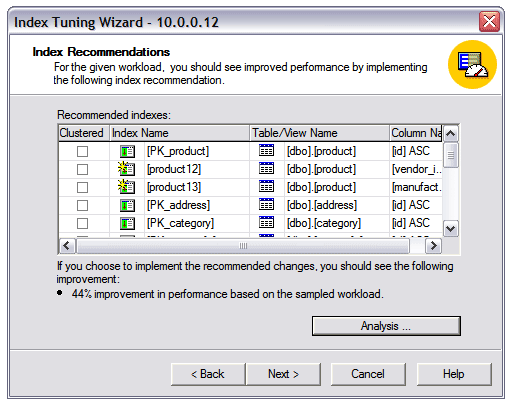
This window shows all the recommendations that have been made in the wizard. You can select any, if needed.
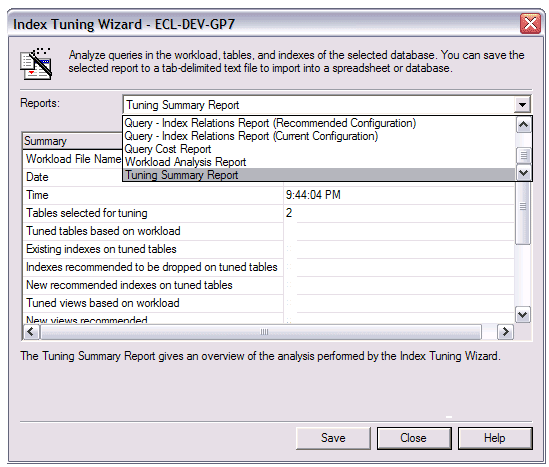
Now click the Analysis button and the following window appears. With the analysis window, you can understand the recommendations in a better fashion that the wizard makes.
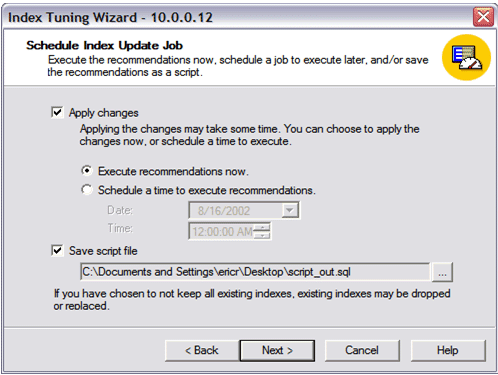
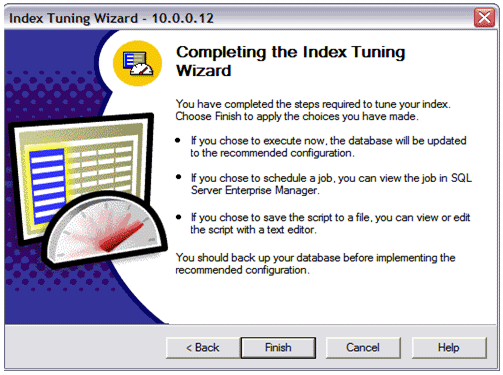
Now you can select apply changes and if needed you can schedule the time. You can also save the script changes. Then click “Next”.
Now if needed you can go back or finish the process or cancel the process.
Thus we have seen, how to use the SQL Server 2008 Profiler and Tuning Wizard in this tutorial, how they both works and steps that are needed to run the SQL Server pofiler against the database and tuning wizard against the profiler trace files.